Should We Believe the Economic Data or Americans’ “Lyin’” Eyes? The Answer Is Yes.
What Americans tell surveyors is generally consistent with the objective data. There has been no long-term decline in economic conditions.
Many Americans are convinced the economy is ailing and that life is financially tougher today than a decade—or a generation—ago. Social media posts wax nostalgic for a long-lost era when all single breadwinners allegedly could afford a home and two cars for a family of four. Everyone seemingly knows someone who did everything they were supposed to do but is now stuck with six figures of student loan debt and a string of gig economy jobs. Economic doomsaying, or “declensionism,” is a mainstay of conventional wisdom.
While financial struggle will never be eradicated—indeed, most of us will experience some kind of economic anxiety at some point in our lives—objective statistics paint an overwhelmingly positive picture of material well-being in the United States. Inflation-adjusted median family income is at an all-time high. Median wealth is, likewise, at an all-time high. Only in 2020 and 2021 were the median weekly earnings of full-time male and female workers higher. The unemployment rate as of 2023 hadn’t been lower since 1969, and it was up only modestly last year.
It would be surprising if these objective measures all simultaneously give a too-rosy picture of the economy. But to sidestep technical methodological points and sow skepticism of objective measures, declensionists sometimes point to indicators that Americans’ subjective views are inconsistent with the economic data.
For instance, two pages into his 2018 book, The Once and Future Worker, American Compass’s Oren Cass wrote that January 2004 was the last time “a majority of Americans….told Gallup that they are ‘in general, satisfied with the way things are going in the United States at this time’”. Strikingly, this sentiment has become rarer since Cass’s book was published. Gallup reports that today, just 20 percent of people say they are satisfied with how things are going.
So, are Americans “right to believe their lyin’ eyes,” as Cass claimed in a recent op-ed titled, “Three Cheers for Economic Pessimism”? This formulation begs the question of whether American beliefs about the economy conflict with objective measures. Cass and the declensionists are no more reliable guides to those beliefs than accurate interpreters of economic data. What Americans tell surveyors is consistent with the objective data, for the most part. There has been no long-term decline in economic conditions.
People Correctly Perceive How They Are Doing and Are Satisfied but Incorrectly Perceive How Everyone Else Is Doing
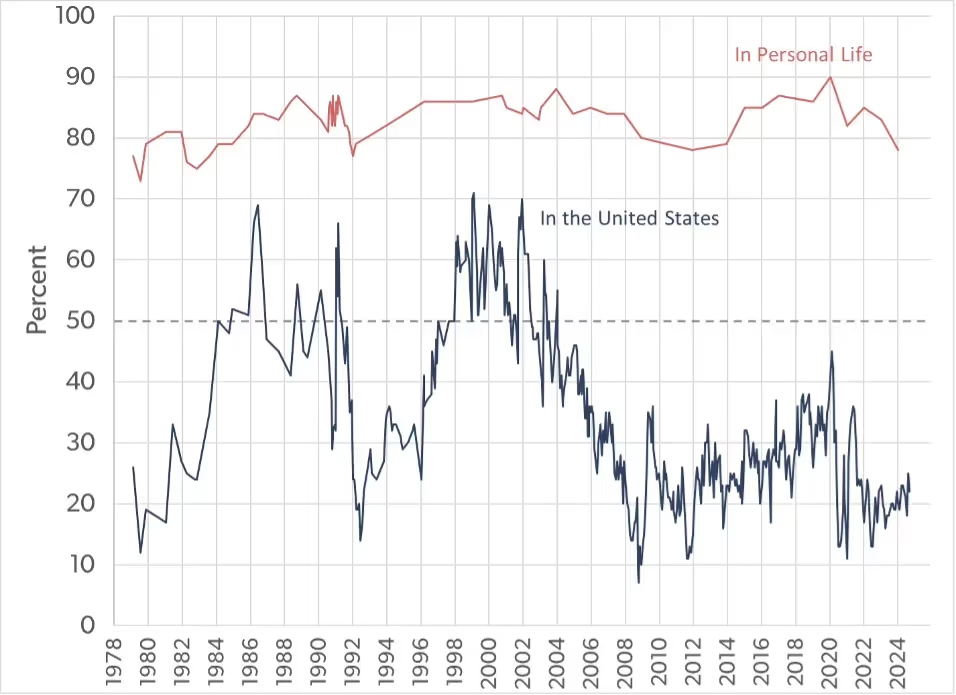
Let’s start with those Gallup figures on satisfaction with the state of the nation. The blue line in Figure 1 shows the whole Gallup trend since 1979. We should first note that it has been relatively rare that a majority of Americans are satisfied with the way things are going. It happened between 1984 and 1991 (though not consistently) and was the case for much of the 1997-to-2004 period. To be sure, current levels of satisfaction are low by historical standards, but general dissatisfaction seems to be the status quo.
Figure 1. Trends in Satisfaction with the Way Things Are Going in the Country and in Personal Life, 1979-2024
Source: Tabulation of Gallup data from https://news.gallup.com/poll/1669/General-Mood-Country.aspx and https://news.gallup.com/poll/1672/satisfaction-personal-life.aspx.
When we focus on people’s impressions of how they themselves are doing, a strong majority of people are upbeat. We can see this in the red line in Figure 1. Gallup asks people whether they are satisfied with how things are going “in your personal life.” In January of 2024, only 20 percent of Americans were satisfied with the nation's state, but 78 percent said they were satisfied with how things were going in their personal lives. In January 2020, right before COVID came to the US, the figure was at an all-time high (going back to 1979) of 90 percent. Only one time in 45 years did fewer than 75 percent of Americans express satisfaction with how things were going in their personal lives.
Dissatisfaction with “the way things are going in the United States” is a feeling based on perception. Crucially, what people perceive to be true about “the way things are going” may not be accurate. They are likely to be very familiar with how things are going for them and their family. But they may be less familiar with how things are going outside their home and community. They may be entirely reliant on media, cultural impressions, and statistics for how the nation is doing.
While people may be dissatisfied with the state of the nation because they think, say, 95 percent of people should be satisfied with their personal lives rather than “just” 78 percent, the more likely explanation for the gap in Figure 1 is that they misperceive how other people are doing. This tendency for people to rate things worse as the subject moves from their own personal lives (which they perceive accurately) to the nation is so pervasive that it has a name: “local positivity bias.” People dislike Congress but reelect their legislators. They think the nation’s schools are failing, but they like their kids’ local school. The phenomenon has also been labeled the “I’m OK—They’re Not Syndrome.”
Whenever you read that 80 percent of Americans are dissatisfied with the way things are going in the US, you should remember that 80 percent are satisfied with the way things are going in their own life. Large majorities of Americans are satisfied with a variety of aspects of their lives. Gallup found in January 2023 that 90 percent were satisfied with their family life, 88 percent with their housing, 87 percent with their education, 87 percent with their work, 84 percent with their community, 81 percent with their health, 77 percent with their leisure time, 76 percent with their standard of living, and 71 percent with their household income. These are mostly down from early 2019 but up from 1995.
Americans Were Big on the Economy before COVID
Even general dissatisfaction with the state of the nation need not imply dissatisfaction with the economy. Economic declensionists attribute every worrisome trend or expression of public concern to economic dysfunction. Certainly, the economy influences people’s assessments of how things are going. But just as obviously, few people will consider it the only factor. Gallup asks Americans how they rate “economic conditions in this country today.” Figure 2, below, shows how responses to these questions have varied during the period each has been asked.
While it’s clear that Americans tend to think things are going well generally when they also think the economy is doing well, this is not always the case. During the mid-1990s, during much of George W. Bush’s first term, and again during the Great Recession, people were more upbeat about things generally than the economy. By contrast, during the expansion following the Great Recession (until the COVID-19 pandemic), Americans felt better about the economy than things generally.
Figure 2. Trends in General Satisfaction with the Country and in Economic Sentiment, 1979-2024

Source: Tabulation of Gallup data from https://news.gallup.com/poll/1669/General-Mood-Country.aspx and https://news.gallup.com/poll/1609/consumer-views-economy.aspx.
Just as it is rare for most Americans to be satisfied with how things are going in the country, it is also unusual for most Americans to rate the economy as good or excellent. However, this was the majority view of the economy in mid-2018, just before Cass’s book was published, and it remained so until the COVID-19 lockdown began in March 2020. At the very moment that Cass was citing most Americans’ dissatisfaction with the way things were going to contend that economic policy was failing workers, most Americans rated the economy as good or excellent. A less committed economic declensionist might have wondered whether factors unrelated to the economy could be behind Americans’ dour mood.
Economic Sentiment Tracks Short-Term Changes in the Labor Market
It is, nevertheless, true that Americans usually rate the economy as being “only fair” or “poor.” And over the more than 30 years that the Gallup series covers, there is clearly nothing like a steady upward march in Americans’ view of the economy. Is that evidence against the claim that economic wellbeing is at an all-time high?
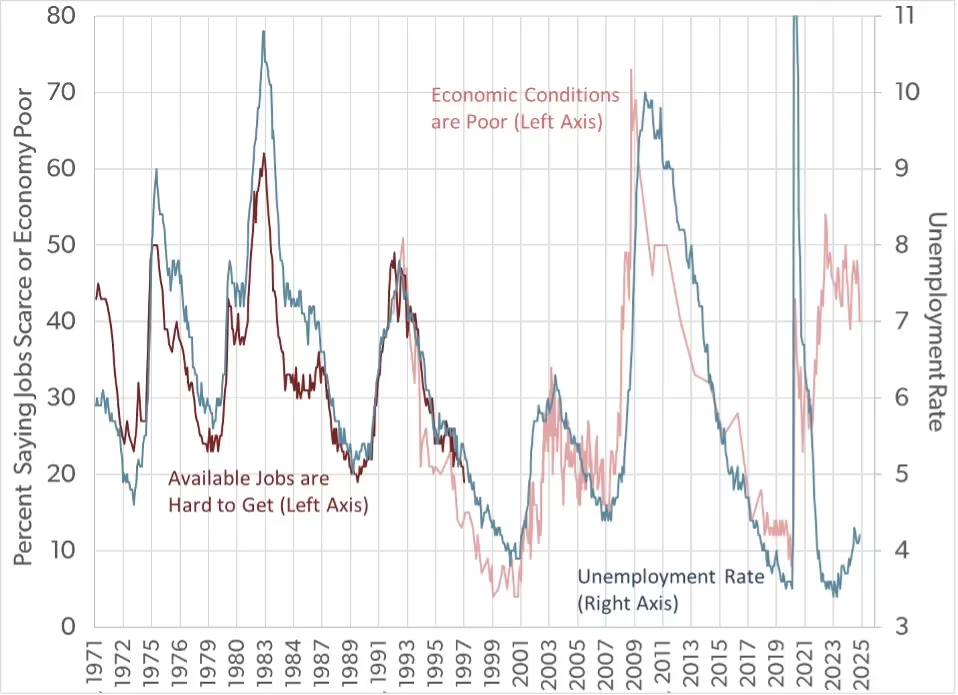
It is not. The ups and downs of the previous chart closely follow the trends in the official unemployment rate, as shown below in Figure 3. The light red line shows changes in the share of Americans who rate economic conditions as being “poor” (rather than excellent or good, as in Figure 2, or only fair). The blue line is the monthly official unemployment rate (seasonally adjusted). I have added a dark red line from an older survey by the Conference Board—the share of adults saying that in their area, the “available jobs” are “hard to get” rather than there being “plenty” or “not so many.” (Lumping “not so many” with “hard to get” produces a similar trend but one that doesn’t line up so neatly on top of the Gallup data.)
Figure 3. Trends in Economic Sentiment and in Unemployment, 1971-2024
Source: Tabulation of Gallup data (economic conditions) from https://news.gallup.com/poll/1609/consumer-views-economy.aspx, data from the Conference Board (available jobs) from the Roper Center for Public Opinion Research’s iPoll website (https://ropercenter.cornell.edu/ipoll), and data from the Bureau of Labor Statistics (unemployment rate) from https://www.bls.gov/cps/data.htm.
We will return to the divergence in the unemployment and Gallup trends over the past few years. This divergence aside, Figure 3 shows that, historically, when Americans have assessed the state of the economy, they have been reacting to short-term changes in the strength of the labor market rather than to long-term changes in living standards. When the unemployment rate is around 6 percent, roughly 30 percent of people are down on the economy or the job market, regardless of the decade. Economic sentiment's upward and downward movement has no relationship with wage, earnings, income, or wealth trends, which do not vary much in the short run except during very unusual times. Whether you think earnings are flat or up 40 percent over the past few decades, they are not as volatile as economic sentiment year to year.
There is another way to express the same point: Over the long run, the trend in the official unemployment rate closely follows trends in subjective assessments of the economy and the availability of work. That offers strong evidence that the unemployment rate is an accurate, objective measure of the labor market's strength. This evidence is important because declensionists sometimes argue that the exclusion from the unemployment rate of jobless Americans who are not looking for work makes it a too-rosy indicator. They contend that the “real” unemployment rate is much higher because many people are so discouraged by the labor market that they have given up hope of finding a job. Since they are not looking for work, they are not in the labor force and are not counted as unemployed. Moreover, because those not in the labor force are a rising share of adults over time, the true trend in joblessness, say the declensionists, is worse than the official unemployment rate suggests.
Economic declensionists might argue that economic sentiment is informed by bad jobless data. Americans’ eyes might be lyin’, but that’s due to lyin’ data. But probing official data on the jobless only reinforces what Americans tell Gallup. Most working-age people who are not in the labor force cite reasons other than an absence of jobs, ranging from being retired or in school to being disabled or taking care of family members. The increase over time in the number of Americans outside the labor force is also primarily due to these factors. Alternative measures put out by the Bureau of Labor Statistics that include discouraged would-be workers who have given up looking for a job or workers who have been involuntarily reduced to part-time employment show trends similar to the official unemployment rate. Using such measures can alter how much joblessness there is, but it doesn’t change the conclusion that involuntary joblessness is at historic lows.
Figure 3 shows that good measures of subjective beliefs about the economy and labor market track the leading objective measure of the strength of the labor market. No lyin’ eyes or lyin’ data here. At least not through mid-2021.
Inflation Explains the Recently High Economic Dissatisfaction
Figure 3 shows that starting in July of 2021, unemployment continued its decline from the COVID peak while the view that the economy is “poor” became more common. Since then, Americans have expressed more economic negativity than expected based on unemployment rates. What accounts for this breakdown of a previously strong relationship? In a word: inflation.
Over most of 2020, economic sentiment improved correspondingly as the unemployment rate fell from its historic lockdown-driven high. By mid-November, the share rating economic conditions poor had fallen to 23 percent—down from the April peak of 43 percent. That was upbeat relative to where unemployment stood. However, December saw the consumer price index (CPI) jump 5.2 percent (on an annual basis, meaning what the increase in prices over 12 months would have been with December’s rate constant). This started a period of high inflation rates through which we may still be living.
Between November 2020 and June 2021, the annualized inflation rate was 6.5 percent. Wages for nonsupervisory and production workers failed to keep up with the CPI, so real wages fell by one percent. By mid-2021, the share of Americans rating economic conditions poor had nudged back up to 26 percent.
Then inflation accelerated again. From June 2021 to July 2022, inflation rose 8.3 percent on an annualized basis. Real wages fell another 2 percent. By mid-2022, 52 percent of Americans rated economic conditions poor.
From July 2022 to November 2024, inflation slowed, growing at an annualized rate of 3.1 percent. Inflation-adjusted wages rose 3.5 percent, and economic sentiment improved accordingly. In mid-November, 40 percent of Americans rated economic conditions poor—still very high given that real wages were higher than before COVID.
Some observers have claimed that political partisans are more likely than in the past to align their economic sentiments with whether they like the political party in power. Democratic and Republican sentiments did move in very different directions after mid-2021. Between April 2021 and October 2024, Democrats became 5 percentage points less likely to say economic conditions were poor, but Republicans became 33 points more likely to say so. However, Independents also became more sour on the economy, with the share rating the economy poor rising by 27 points. A careful reading of some other analyses looking at the rising importance of partisanship reveals the same finding.
Nor does the divergence of economic sentiment and unemployment hinge on whether Americans are asked about the national economy or their own “financial situation.” The same divergence occurs using Gallup data on the latter.
While inflation has moderated, the increase in prices since the start of 2020 has been around 2.5 times higher than would have been the case had inflation rates remained at pre-COVID levels. Prices today would be 10 percent lower in that counterfactual. Real wages are higher than before COVID, but perhaps the decline from the end of 2020 until mid-2022 was felt more strongly than the subsequent rise.
So, the economic dissatisfaction over the past three-and-a-half years is real, but it has nothing to do with the state of the job market, which is strong. Rather, it relates to the high inflation that occurred in the wake of the COVID pandemic. This inflation was exacerbated by the American Rescue Plan Act, which distributed government benefits to an American citizenry that was already flush with cash from the 2020 COVID spending. President Biden and Vice President Harris paid a dear price for this inflation, but it resulted from a policy mistake, not from fundamental problems with the American economy or pre-COVID economic policies that neglected workers.
Americans Rate Their Own Financial Situation More Positively than They Rate Economic Conditions Generally and No More Negatively than In the Past
Finally, returning to the “I’m OK, They’re Not” Syndrome, negative sentiment toward national economic conditions does not translate into most Americans feeling they are personally struggling financially. In April 2024, 44 percent of Americans told Gallup they rated economic conditions in the US “poor,” while just 24 percent rated them “good” or “excellent.” The same month, Gallup asked the same respondents to rate their “financial situation.” The numbers were flipped: 46 percent rated their situation good or excellent, while just 17 percent said poor.
It's true that that 46 percent falls just short of a majority of Americans. This fact is somewhat surprising given the super majorities (in excess of 70 percent) who tell Gallup they are “satisfied” with their living standards and their household income. The answer must be that many people are satisfied with their personal financial situation being “only fair” rather than good or excellent. (Remember that few people rate their situation as poor.)
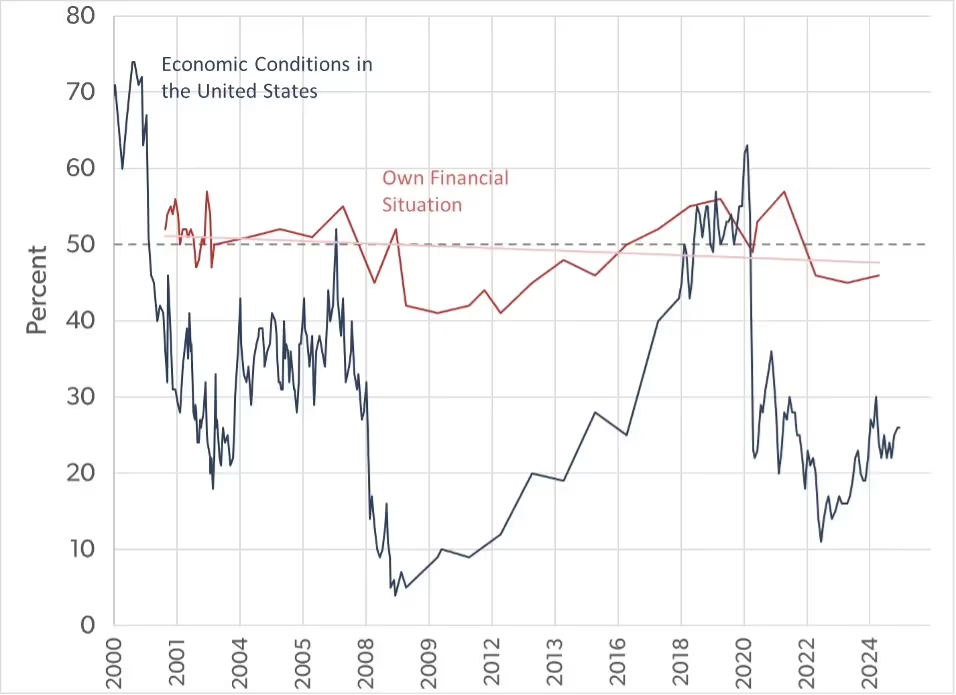
More relevant for assessing how we should feel about the 46 percent figure is the context provided by a trend. Gallup asked Americans about their personal financial situation 44 times from August 2001 to April 2024. The blue line in Figure 4 repeats the trend from Figure 2 in the share of Americans rating national economic conditions as good or excellent. The dashed line at 50 percent confirms that this has mostly been a minority position over the years. However, around half the population has rated their financial situation good or excellent, as shown by the dark red line. The share was below 50 percent during the Great Recession and above during the subsequent boom years. The light red line indicates the linear trend over these 24 years, which nearly sits on the 50 percent line.
Figure 4. Share Rating National Economic Conditions and Personal Finances “Good” or “Excellent,” 2000-2024
Source: Tabulation of Gallup data from https://news.gallup.com/poll/1609/consumer-views-economy.aspx and https://news.gallup.com/poll/1621/personal-financial-situation-index.aspx.
It’s clear from Figure 4 that, like ratings of the national economy, sentiment about personal financial situations fluctuates over the short run with the business cycle. It is much less sensitive to swings in the economy than are general perceptions of the economy. The trend does not reflect rising real household income, but neither does it suggest a long-term deterioration in subjective assessments of the economy.
In fact, as recently as 2019, the share of Americans rating their financial situation excellent or good returned to its peak over the 24 years (57 percent). The share has dropped since then, but even the recent bout of inflation has left people relatively upbeat about how they are doing. While not shown in Figure 4, Gallup asked this same question about personal finances one other time, in May 1994. Just 47 percent rated their personal financial situation good or excellent then—about the same as in the early months of the Great Recession. That things were largely stable during the period in which China entered the World Trade Organization and deaths of despair soared hardly suggests that economic trends were hurt by the former or caused the latter.
In short, a careful analysis of public opinion data paints a picture of the economy consistent with objective measures. The recent bout of inflation—a problem no American had experienced in 40 years—altered a clear long-term relationship between economic sentiment and the official unemployment rate. Subjective measures of the economy’s health fluctuate with objective measures over the short-run. In a future column, I’ll explore whether inflation-adjusted income trends are consistent with subjective assessments of how living standards have changed over the long run.
Scott Winship is a senior fellow and the director of the Center on Opportunity and Social Mobility at the American Enterprise Institute.
Economic Dynamism

The Causal Effect of News on Inflation Expectations
This paper studies the response of household inflation expectations to television news coverage of inflation.
.avif)
The Rise of Inflation Targeting
This paper discusses the interactions between politics and economic ideas leading to the adoption of inflation targeting in the United States.
The Revenge of the Supply-Siders
Trump would do well to heed his supply-side advisers again and avoid the populist Keynesian shortcuts of stimulus checks or easy money.

U.S. Can’t Cave to Europe’s Anti-Growth Agenda
One does not have to support protectionist tariffs or protracted trade wars to see why Washington needs to continue using trade to pressure Eurocrats to give up micromanaging tech platforms and supply chains around the world.


.jpg)



.jpg)


